Usual website analytics show Google as a traffic source but cannot show exactly which search terms brought people to your website. Google stopped passing search queries in referrer data years ago. This means you need to open Google Search Console in a separate tab to see which search terms bring traffic to particular pages on your site. Then you need to return to your analytics to see what those visitors did next.
Plausible puts both in one dashboard. Connect Google Search Console to see which search terms bring people to your site, which pages they land on and what they do after arriving.
You can then check conversions and funnels for Google traffic, narrow the search terms by page, country or device and save useful combinations as segments.
No Google Analytics. No extra script. No custom report.
"My 100% favorite GA4 alternative so far is Plausible. Not free and not a ton of bells and whistles, but SOOOO easy to use (for clients too) and the data is near real-time. A good solution for ~70% of websites struggling with GA4."
"I use Plausible for traffic analytics. Privacy-friendly, no cookie banner needed, lightweight script that doesn't slow down the page."
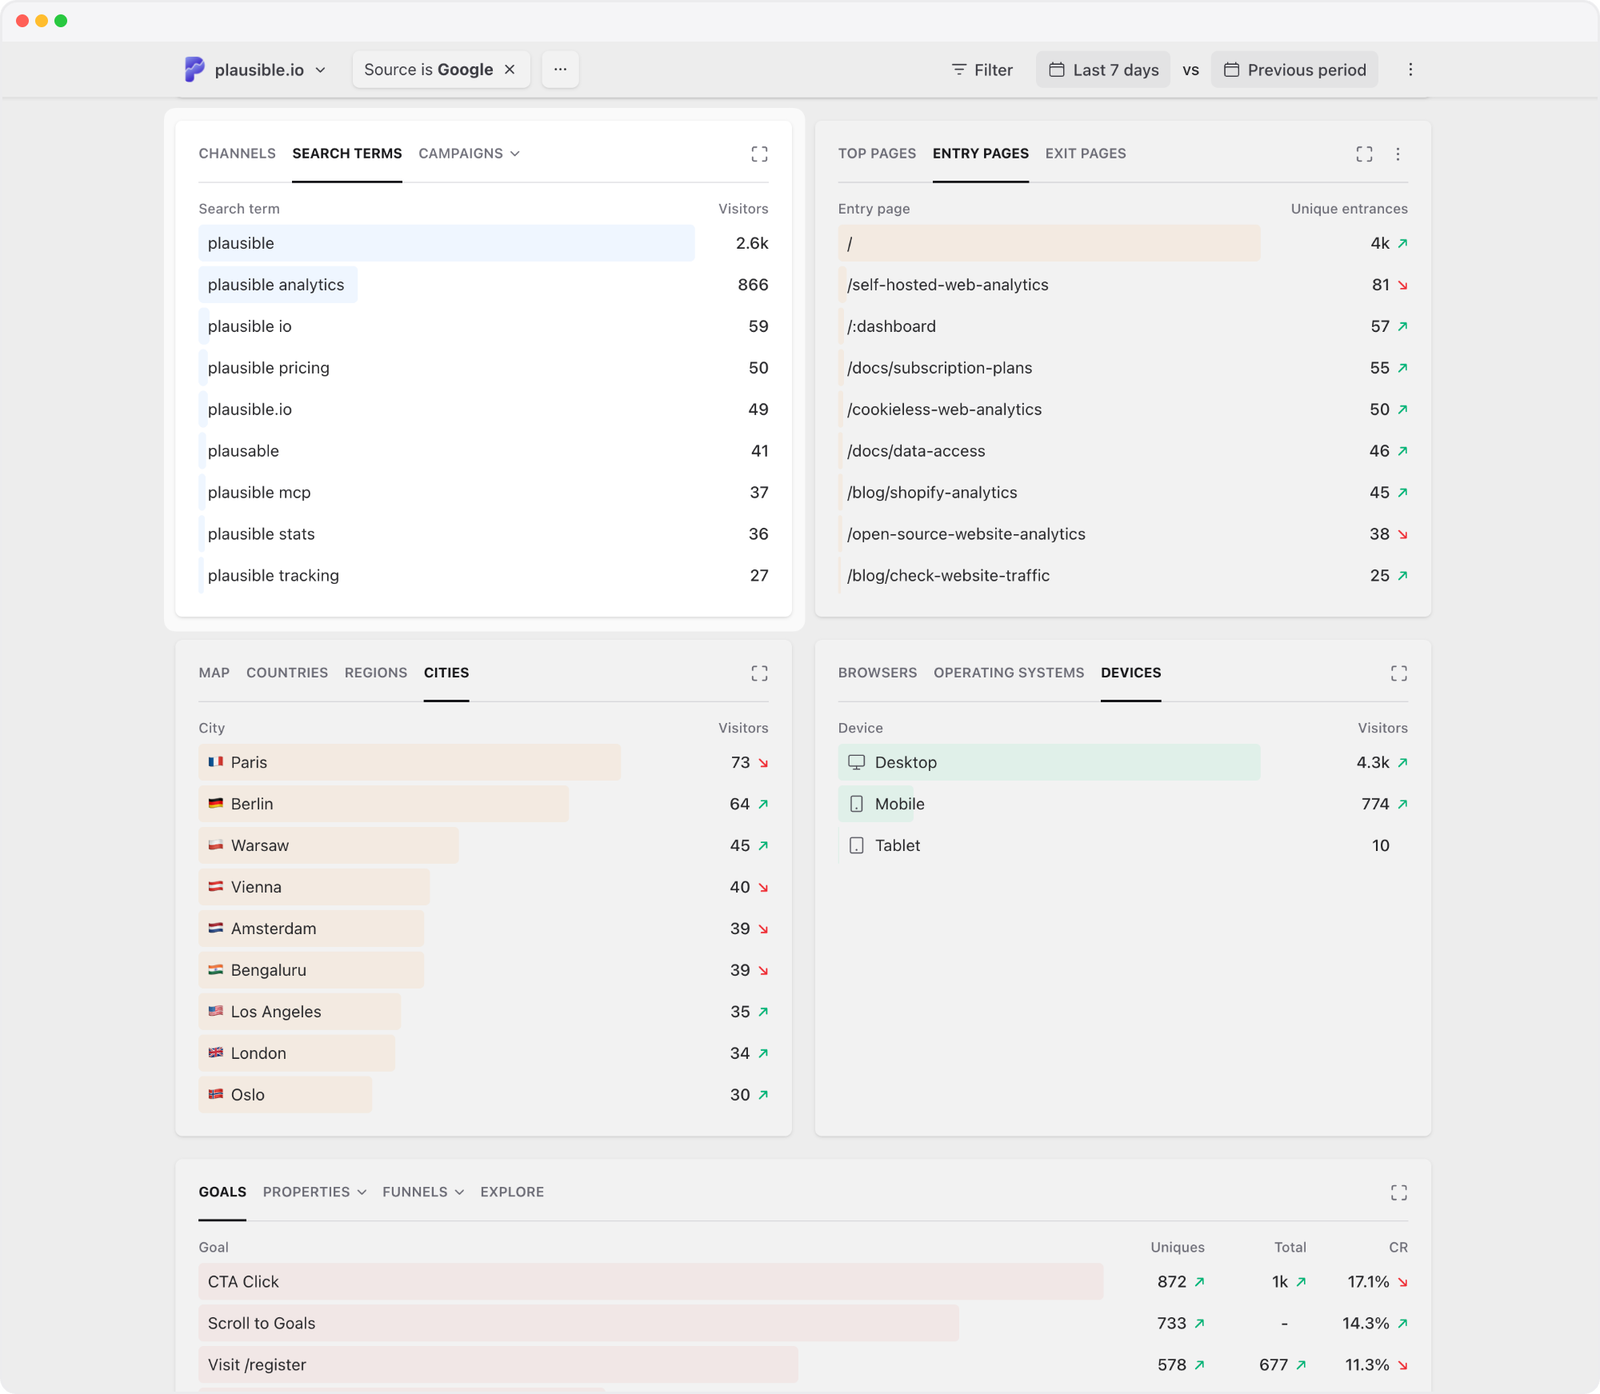
- Understand what brings people from Google and what they do next
- Narrow the search report to the audience you care about
- One dashboard instead of GA4’s separate Search Console reports
- Privacy-friendly by design
- Get started with Plausible Analytics
Understand what brings people from Google and what they do next
In Plausible, you can select Google under Sources to see the Search terms report. It lists the queries that received at least one click to your site.
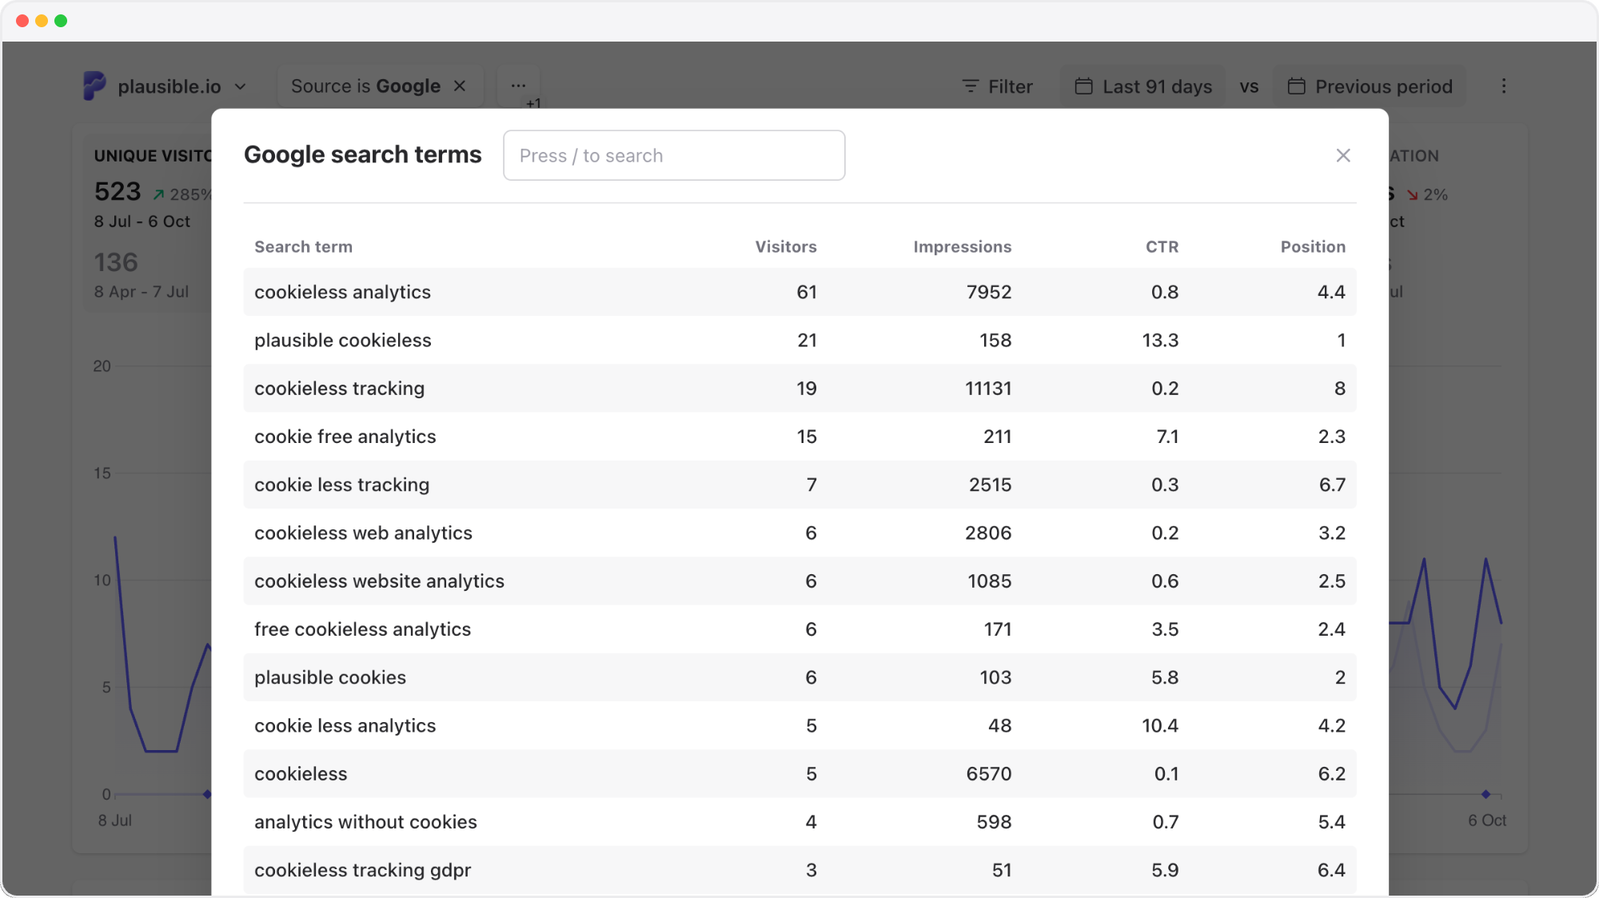
Expand the report to compare impressions, click-through rate and average position for each query. Together, these figures show whether a page is appearing more often, earning a larger share of clicks or moving up or down in the results. Compare date ranges to see which searches gained or lost traffic, including terms you were not already tracking.
Find the pages attracting search traffic
Use Entry Pages to see where visits from Google began. Select one and the Search terms report updates to show the queries associated with that landing page. This can tell you whether a new or updated page is appearing for the searches you intended.
Top Pages answers a different question. It includes every page Google-referred visitors viewed, even if they reached it after landing. Comparing the two shows which pages attract search traffic and which pages people visit next.
See whether Google traffic leads to conversions
Because selecting Google filters the whole dashboard, your Goals and Funnels reports update to that audience too. You can see whether Google visitors sign up, purchase, download something or complete another goal, then follow them through a funnel to see where they drop out.
If revenue tracking is configured, you can also see purchases, total revenue and average revenue from Google-referred visits. This helps distinguish pages that merely attract traffic from those that contribute to a result.
See how Google visitors engage with your site
Traffic volume alone does not show what people do after arriving. With Google selected, you can see whether visitors leave after one page, spend time reading or continue to other pages. Bounce rate, visit duration, views per visit, time on page and scroll depth provide that context.
These metrics cannot explain why someone behaved a certain way, but they can show which pages deserve a closer look. If a page gains search clicks while engagement falls, review what changed. If visitors spend more time or explore further, you can identify the pages that hold their attention and build on them.
Narrow the search report to the audience you care about
Filter the dashboard by page, country or device and the Search terms report updates for that segment. This helps answer focused questions without building a custom report:
- Filter by an entry page to see the searches associated with that landing page
- Filter by locations to see which queries bring clicks from a target market
- Filter by device to investigate a difference between desktop and mobile search performance
- Combine filters to study, for example, the mobile queries for one landing page in one country
The other dashboard reports follow the same filters, so you can compare the search terms with the corresponding traffic and engagement view. Save a combination as a segment if it is something you want to check regularly.
One dashboard instead of GA4’s separate Search Console reports
Many people choose GA4 for its native integrations with other Google products, including Search Console, but the experience can be surprisingly clunky.
GA4 can connect to Search Console, but it does not add query data to its regular analytics reports. The integration adds two separate reports:
- Google Organic Search Queries shows queries with Search Console metrics. It cannot be broken down by Analytics dimensions.
- Google Organic Search Traffic shows landing pages with Search Console and Analytics metrics. It can be broken down by country and device.
The Search Console report collection is also unpublished by default, so someone with the right access needs to find and publish it first. Search Console metrics in GA4 are only compatible with landing page, country and device.
To investigate engagement or conversions, you may still need to move between the Search Console reports, acquisition reports and landing-page reports. Google’s integration documentation explains these reporting limits.
Plausible keeps this workflow in one simple dashboard. Select Google once, then move between search terms, entry pages, engagement, goals, funnels and revenue with the same source filter applied.
Like Plausible, GA4 cannot connect an individual search query to an individual visitor or conversion.
Privacy-friendly by design
Plausible is a privacy-friendly web analytics tool. It works without cookies, personal data or cross-site tracking. Connecting Search Console does not change how Plausible measures visits or add Google code to your website.
Google sends Plausible the search-performance information it has already collected in Search Console. Plausible fetches query, click, impression, click-through rate and position data from the Search Console API when you open the report. We do not store that search data in our database. We only store the authorization details and selected Search Console property needed to keep the connection working.
Get started with Plausible Analytics
You can start with a 30-day free trial. No credit card is required and nothing is charged automatically when the trial ends.
- Create your Plausible account, verify your email address and add your website.
- Add the Plausible tracking script to the
<head>of your site. The snippet is shown while adding the site and remains available in your site settings. Use an integration guide if you install through WordPress, Google Tag Manager or another website platform. - Verify the installation and wait for your first visit to appear. You can also set up goals, funnels or revenue tracking for the actions you want to evaluate alongside Google traffic.
- Make sure the site is verified in Google Search Console. Both domain properties and URL-prefix properties are supported.
- In Plausible, open the site’s Settings, select Integrations and choose Continue with Google. Allow access to Search Console data, select the matching property and save it. The complete Search Console setup guide covers property verification, Google permissions, connecting more than one site and troubleshooting.
Return to the dashboard, open Sources and select Google. The Search terms tab will show query data once Google has made it available.